Downloads
DOI:
https://doi.org/10.7480/overholland.2017.18/19.2437Abstract
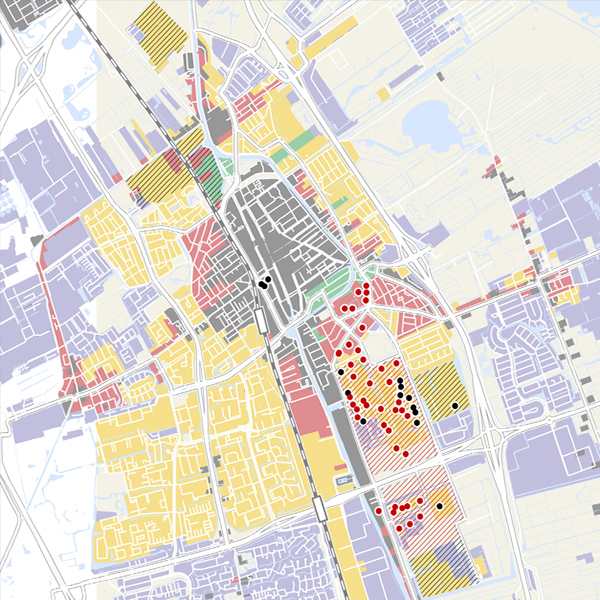
To allow systematic comparison of the construction and transformation of the Delft and Eindhoven University of Technology campuses, maps and profiles have been drawn. Below we describe the method used to draw them and indicate which sources were used.
The maps are based on what we call the chronological development map of the Randstad conurbation. This is a digital GIS map file, a kind of ‘parent file’ developed as part of the ‘Mapping the Randstad’ research project. The map, various versions of which have been published in OverHolland, shows the spatial development of Holland’s towns and cities with reference to ‘morphological periods’: the periods up to 1850, from 1850 to 1910, from 1910 to 1940, from 1940 to 1970 and from 1970 to 2000.
How to Cite
Published
Issue
Section
License
Copyright (c) 2017 OverHolland

This work is licensed under a Creative Commons Attribution 4.0 International License.
