Abstract
The research that the 5x5 project is based on partially consists of intensive map studies. The first part of these studies, presented in OverHolland 5, shows a Randstadscale map with the expansion of the builtup urban area and a map showing the railway infrastructure development, compared to the 18thcentury bow hauling network. On an urban regional scale, the study reveals a map matrix of the ‘changing’ locations of the station areas in relation to the expansion of the builtup urban area. In addition, three map sections from the five station areas show the morphological conditions around 1830, 1910 and 2000.
In this second part of the map research, two map images were elaborated for each city. The first map image shows when the railway was first put into use. In addition to the railway, the main connecting roads between the cities are also shown. The urban area on these maps was drawn based on the historical cadastral plans dating from around 1830. The cadastral plans document the state of urbanisation just before the large city expansions and radical changes in historical centres. The townscape, as depicted on the historical cadastral plans, generally corresponds with the situation at the time when the railway network was built. The characteristic element of the Dutch peat landscape is its water structure. Rivers and parcel ditches were drawn based on the topographical and military map of the Kingdom of the Netherlands, dating from between 1850 and 1864.
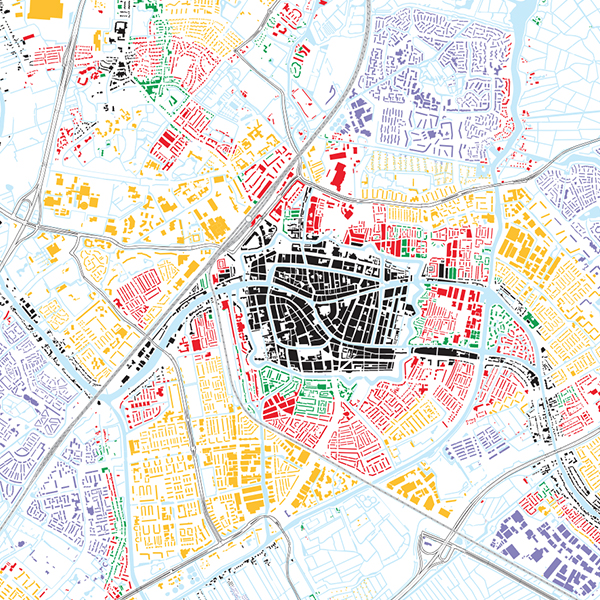
The second map image shows the situation around 2000. Using colour coding for separate buildings, the expansion of the builtup urban area has been itemised for 1850, 1910, 1940, 1970 and 2000. The colours used do not necessarily indicate the period in which the buildings in question were actually built. Transformations of parts of the city after their expansion period are coloured according to their expansion period. Therefore for example, the transformation of the Northeast part of Gouda’s inner city up to 2000 is shown in black, the coding of the builtup urban area until 1850. Often however, the period of the expansion of the builtup urban area matches the period in which it was actually established.
The builtup urban area, national and secondary trunk roads, railways routes and water structure around 2000 are adaptations of the digital Top 10 vector map.
With this series of ten maps for five cities, the urbanisation around 2000 is shown per city, the beginning on the one hand and the ‘halftime score’ on the other. By using an unambiguous coding, drawing style and scale, the maps can be mutually compared and specific features can be read. Therefore, the different periods of city expansions clarifies to which extent the railways zones were a barrier for urban area expansions on the ‘other side’ of the railway, and how because of this, station area locations were moved from the periphery to the ci
How to Cite
Published
Issue
Section
License
Copyright (c) 2008 OverHolland

This work is licensed under a Creative Commons Attribution 4.0 International License.
